Things go wrong in software all the time, and that's normal. As developers, we have a responsibility that when things go wrong, we make concious decisions to either fix the problem or to accept the risks that it poses. This is where alerts/monitors come in. In a practical sense, they let us say something like "Send a slack notification to our team when there are more than 3 error logs on lambda service FooService in any given hour".
With alerts, we need to be very careful though, as having too many alerts can lead to alert-fatigue, where we get pinged so often in slack/emails that we start ignoring or not taking seriously alerts as they come through. This leads us to consider quite a few decisions with each alert we create:
- Should we have different thresholds for warnings/actual error alerts?
- What priority is this alert, and who should be alerted by it?
- Do external customers care if this alert goes off (we can do things like update status.transcend.io)
- Do we want to limit this alert to only go off once per day, or do we want to re-alert every hour?
- Should this alert link to a disaster recovery playbook?
- Should we give an alert if no data is collected on the observed metric for a given timeframe?
along with many others.
All of this is to say: Monitors need a lot of configuration options, a lot more than I would have initially thought at least, to work well. Datadog has a nice UI for creating these monitors, which will be the first thing we explore.
But this approach does not always feel very scalable, as we also need to value consistency, which is not a strength of Datadog's UI. We may want a similar monitor in dev, staging, and prod, with just a few resource names changed. Or we may want multiple similar alerts inside a single environment that all examine log queries that should all have the same configuration settings, just different queries. Ensuring consistency like this is where config files / code shine, so we'll also explore creating monitors programmatically via Terraform.
Given these two options for creating monitors (UI vs code), you may wonder when you should pick each pattern. The great news is, you don't need to pick! This codelab will also show how you can create monitors in the UI and then import that monitor into Terraform, getting the best of both worlds.
At the end of this codelab, the goal is to show how to quickly make alerts in the dev environment in the web UI, then import that alert into Terraform, allowing you to quickly scaffold up a similar alert in other environments.
Now for a haiku:
The best of both worlds
UI quickly iterates
consistent through code
In datadog, you can monitor just about any value you can find in the console. Let's look at two of the more common things you may want to create metrics for: error logs and metrics.
Querying Logs
When you go to Datadog's logs page, you will see all logs for our services in all environments (dev/staging/prod). This is rarely useful, as you typically will want to look at some subset of the logs, like for a specific service, in a specific environment.
In the GIF above, notice how you can search for a service by name and filter by log level. As you select options from the dropdowns on the left sidebar, you'll notice that the top text box updates with a special query syntax. This query can be copied to monitors in later steps.
Exploring metrics
Datadog has a page dedicated to exploring what metrics exist and seeing previews of their values. As you can see in the GIF above, you can search for specific metrics and apply filters. If you want to monitor an SQS queue, try typing sqs into the Graph search bar and see what metrics come up. Likewise, search applicationelb for load balancer metrics, cloudfront for CloudFront metrics, etc.
Most of the time, you should be able to find the metric you want just by exploring like this, without needing to consult any sort of list with what metrics exist. It's pretty great!
Creating Custom Metrics
If you can't find the exact metric you're looking for, you can consider creating a custom metric in code and then putting something like airgap_telemetry_backend.receiver.dynamo_updates.error as the metric name to search for.
For more information on custom metrics, check out Datadog's documentation or blog post on the topic.
Explore this haiku
Logs can be filtered
Explore metrics like Dora
Even custom ones
We just saw how to filter Datadog to search for specific metrics/logs to create alerts on. Now let's get to the a creatin' o' ‘e ‘l'rts. Over time, you may become more comfortable creating DataDog monitors directly in Terraform via copy-paste-edit coding, but starting in the UI is a good way to get exposure to what options you have available.
Positive : As a recommendation, create your monitors in the dev environment to start.
Start by heading to the create monitor page
Create a log monitor
Select Logs as the monitor type, pasting in the query from your filter on the logs page earlier.
The GIF above shows an example of a monitor that will alert the #p1-monitoring slack channel every 24 hours that there are error logs under the airgap-telemetry-backend service.
This is all just an example, as the monitor you wish to create may need entirely different settings for your log query. But whatever you need, the UI should guide you through the steps to create the monitor.
Create a metric monitor
Select Metric as the monitor type, adding in the fields from the metric explorer we filled out earlier.
You can add thresholds (which use the units on the y-axis of the graph) which determine when an alert should fire for the given metric. If you check the preview graph at the top of the page to see when the alert would have fired on your historic data.
Monitor your heart rate as you read this haiku:
Monitor the thing
Monitor another thing
Monitor all things
Let's pretend you just created this monitor in DataDog.
It monitors the latency of our API Gateway in front of https://telemetry.dev.trancsend.com and alerts whenever the requests start taking to long, how neat is that?
Example of a production monitor
This particular monitor is defined in our monorepo here: link, and looks like:
resource "datadog_monitor" "p90_latency" {
  name = "Latency is high on the airgap telemetry backend in ${var.stage}"
  type = "query alert"

  query = "avg(last_1h):avg:aws.apigateway.latency.p90{apiname:${var.stage}-airgap-telemetry-backend} > 5000"

  message            = <<-EOT
    The p90 latency on the airgap telemetry backend is {{value}} @slack-${var.monitor_slack_channel}
  EOT
  escalation_message = <<-EOT
    The latency on the airgap telemetry backend is still high, and has been for at least one day.
  EOT

  monitor_thresholds {
    critical = 5000
    warning  = 2000
  }

  no_data_timeframe   = 0
  notify_no_data      = false
  evaluation_delay    = 900
  renotify_interval   = 1440 # Only renotify if not fixed for 24 hours
  require_full_window = true
  priority            = var.monitor_priority

  notify_audit = false
  timeout_h    = 0
  include_tags = true

  tags = local.monitoring_tags
}
Reading through that, hopefully it makes sense at a high level. Outside of the odd-looking query syntax, this blob of code should look fairly similar to the form we just filled out creating a monitor in the UI, just with terser names. But the big question is, how would one write this from scratch?
Finding the docs
Start by heading over to the Terraform Registry. Make your way to the DataDog provider and look for the datadog_monitor resource.
This page gives an in-depth overview of all fields on the datadog_monitor resource, which in some cases provide even better documentation than Datadog's tooltips in the UI (not always).
Writing a Terraform Snippet
Negative : If you are an external reader, you can just create a file named main.tf and follow along with the sample code.
Picking where to put your terraform code can be a bit tricky, especially if you are new to Terraform/Terragrunt/our setup.
The good news is that many of our services already have datadog monitors defined for them, so you can search for datadog_monitor in .tf files inside the directory under infra/ for whatever service you're working on to find a good place to add your monitor to.
The best news is that each engineering team should have folks with monitoring experience on them that can point you in the right direction for where to add the code. If you're in doubt, reach out in #p0-monitoring or #engineering (not #engineer, which is for train-related discussion) on Slack.
For demo purposes, I'll create a file main.tf inside ~/transcend/main/infra/codelab-sample with the contents:
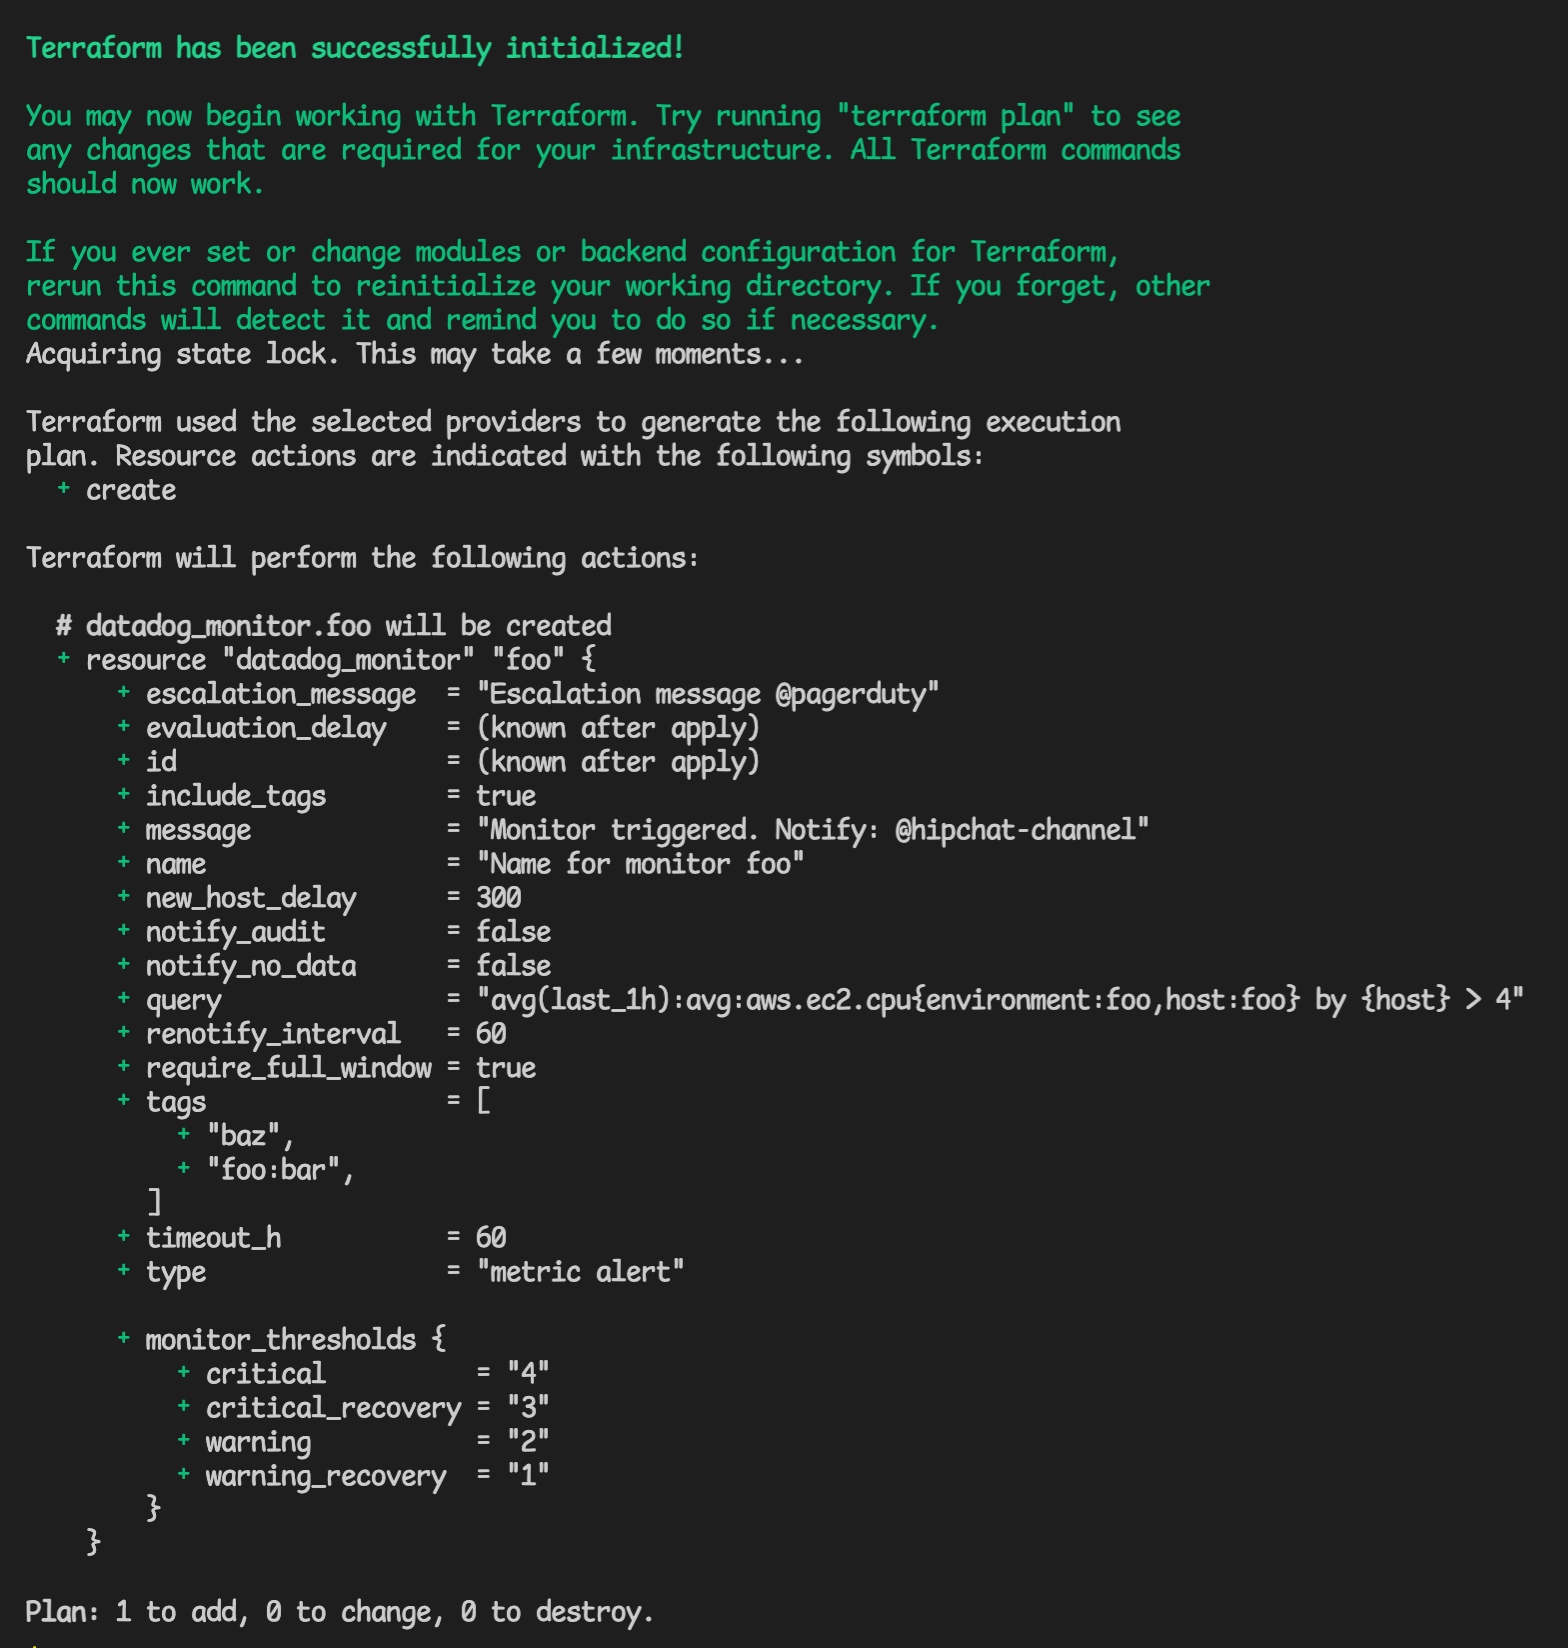
resource "datadog_monitor" "foo" {
  name               = "Name for monitor foo"
  type               = "metric alert"
  message            = "Monitor triggered. Notify: @hipchat-channel"
  escalation_message = "Escalation message @pagerduty"

  query = "avg(last_1h):avg:aws.ec2.cpu{environment:foo,host:foo} by {host} > 4"

  monitor_thresholds {
    warning           = 2
    warning_recovery  = 1
    critical          = 4
    critical_recovery = 3
  }

  notify_no_data    = false
  renotify_interval = 60

  notify_audit = false
  timeout_h    = 24
  include_tags = true

  tags = ["foo:bar", "baz"]
}
This is copy-pasted code directly from the Terraform Registry's example code, so no worries if it doesn't immediately match the monitor we're using as our example.
Running a terragrunt plan in that directory should show you a plan output like:
Importing a resource into Terraform
This shows that a new monitor will be created, when what we really want is to bring the already existing monitor into terraform's control. To do this, run terragrunt import datadog_monitor.foo 43381009, where datadog_monitor.foo is the name of the resource in terraform, and 43381009 is the ID of the monitor from the url https://app.datadoghq.com/monitors/43381009.
Now when you re-run terragrunt apply, you should see output telling you that you will be modifying an existing resource, like:
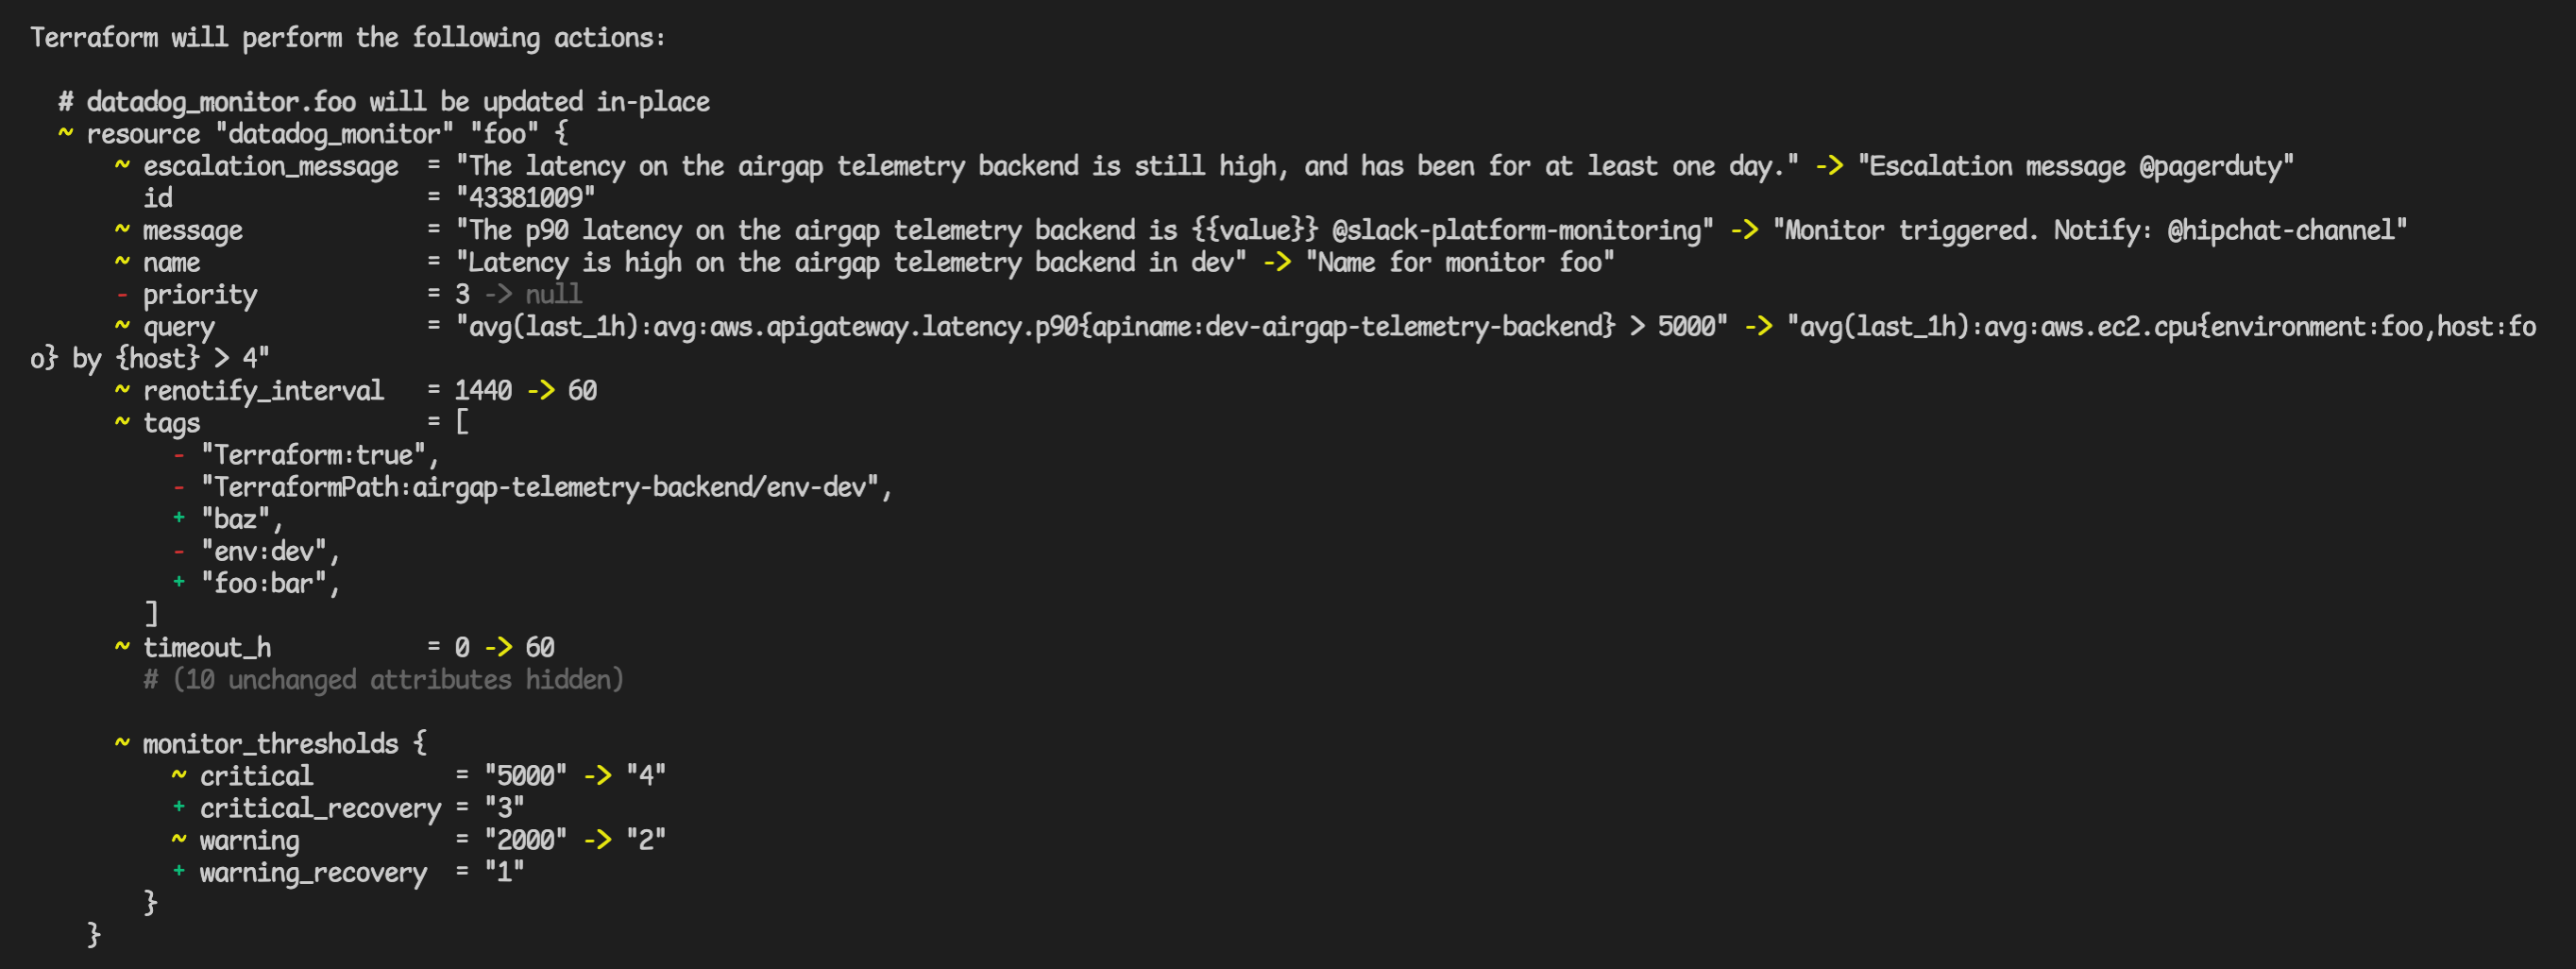
Doing some detective work, you can see what the old values were thought to be in the terraform config. You can then go through each change and either:
- copy the config from the live monitor into the terraform code
- decide that you prefer the values in the code and not change them
If you do make any changes, a terragrunt apply will make the dashboard reflect your code changes.
Here's an import-ant haiku:
Twas in DataDog
Tis now in the Terraform
But how to deploy?
If you've been following along, you'll now have a terraform configuration that matches a remote monitor you made. Most likely, the monitor has filters on it. These filters may be things like "only in the dev env" or "only on a specific load balancer named NightDragon", which would be a sick name for a load balancer.
Productionizing this code is easy: we just need to remove the hardcoded values from our filters, replacing them with terraform variables.
So instead of a query having
query = "avg(last_1h):avg:aws.apigateway.latency.p90{apiname:dev-airgap-telemetry-backend} > 5000"
you could change out the dev-airgap-telemetry-backend part to be a variable (or derived from a variable) with something like:
query = "avg(last_1h):avg:aws.apigateway.latency.p90{apiname:${var.stage}-airgap-telemetry-backend} > 5000"
where the stage variable would be defined as:
variable "stage" {
  description = "The stage to deploy to like dev/staging/prod"
}
Just like that, the Terragrunt module that calls this Terraform module can supply a stage input with a value dev, staging, or prod, which will allow for this single alert definition to turn into three separate monitors in Datadog, one for each environment.
Once there are no more hardcoded cloud resource names, your module should be ready to deploy!
Got rid of the names
Yeeted out the ARNs
Add Variables
To start the deploying process, push your code up to a new git branch and open a PR on Github.
In the happy case scenario, you may be done with just that. Our CI system, Atlantis, will create plans of what infra needs to change from your PR, and will display a plan in comments on the PR (this step is expected to fail for security reasons if you do not have elevated permissions to deploy in production). An admin will then come in and comment atlantis apply to deploy the new monitors.
In the sad case scenario, the plans on CI will have errors. These errors are not always easy to read on the PR if you're new to terraform/terragrunt, but know that you should be able to get the same error message locally by running terragrunt plan in the directory that the error is marked for.
All engineers should have permissions to change our entire dev environment via terraform, so my suggestion to debug would be to try to deploy your code with terragrunt apply in the dev environment. If you can deploy your code to the dev env locally, it is very likely to succeed when deployed to staging/prod by our CI systems.
Atlantis deploys
All you need to do is push
And fix the errors
It is certainly possible to just use the Datadog dashboard to create monitors, avoiding terraform entirely. Here is an incomplete set of thoughts on why Terraform is often preferrable:
Terraform pros:
Consistency across envs
If the only difference between dev/staging/prod is the input variables to the same terraform module, we can ensure that the same things are monitored in each environment (possibly with different priorities, messages, thresholds, etc.)
Consistency across monitors
One example of a common misconfiguration is not setting a renotify_interval without a reason. This field controls how long after an error triggers it should become triggerable again. When it is not set, errors can get incredibly spammy, possibly posting the same message every few minutes/hours without waiting for a fix.
This is easy to verify when looking at the code. While certain parts of the config (mostly the query) are easier to generate in the console, the rest of the config is generally easiest to copy-paste from other monitors.
This makes it more likely that each new monitor has things like escalation messages specified, which are tedious to create in the console, but often are pretty easy to copy-paste-edit from other config code.
Reviewed by peer
Code review is a thing, and is a thing we really like at Transcend. It will let people ensure that your code is consistent with our overall monitoring strategy.
Getting a second set of eyes on things as important as monitors is never a bad idea.
copy-pastable / reusable in modules
Terraform is very easy to copy-paste, and can be reused in modules as well to succinctly do things like add alerts to each load balancer.
SOC II
There are certain monitors that we need to have to keep our security auditing software, Vanta, happy. By having the monitors in code, we can ensure the monitors are all accounted for.
Managing changes is easier
Say we update the name of one of our load balancers. If you made the monitors in the console, you'd need to find all monitors relating to the old name, and update them one by one to use the new name.
In terraform, you often don't need to do anything, as our terragrunt dependencies should automatically detect that the monitors need to be updated in the PR that updates the name of the load balancer.
The only thing worse than not having a monitor for something important is having a monitor that you think is working that is not, because the thing it monitors has changed.
Terraform encourages haikus
Okay it doesn't, but I do have a haiku to share:
Justification
Of why Terraform is fine
And you should use it